Use Case: Bringing Meaning to Roughness and Color Data Through High-Resolution Visual Analysis
Customer: Kreysler & Associates
Parts: Surface finish of large architectural panels
Product: Magnify2
Challenge
Across the 250,000+ square feet of surface area, each of the 1200+ architectural panels needed to maintain a color variation of less than 1.5 Delta E. While tight controls were in place to manage the color early in the manufacturing process, unexpected color shifts in the later stages of surface finishing and even after installation were of great concern.
Profilometer and spectrophotometer data suggested a correlation between surface roughness and a shift in the L value of the color readings. The correlation between Ra and color steep, it was found that a roughness change of 50uin induces a color change of roughly 0.5 delta E (30% of the color tolerance). Even worse, our spread of Ra on finished panels is a range of about 160uin (exceeding the entire color tolerance of 1.5 delta E).
However, the data lacked the contextual information to understand what was really going deep in the microsctructures of the surface.
Results
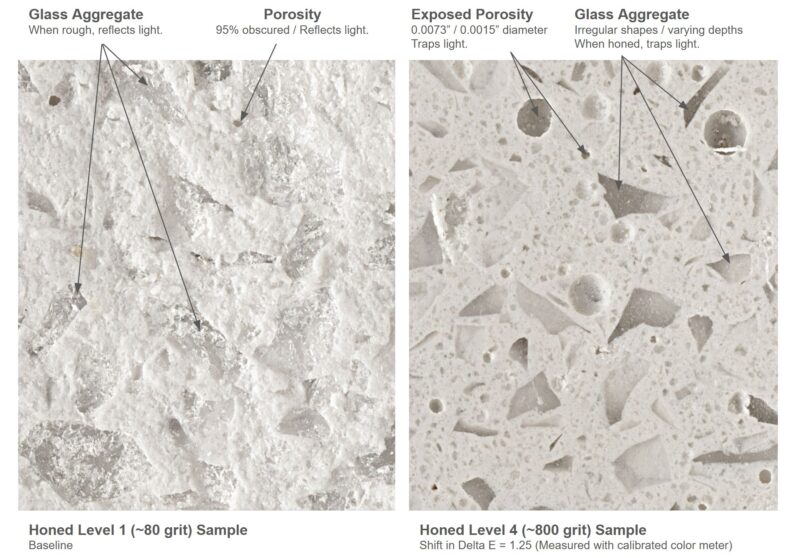
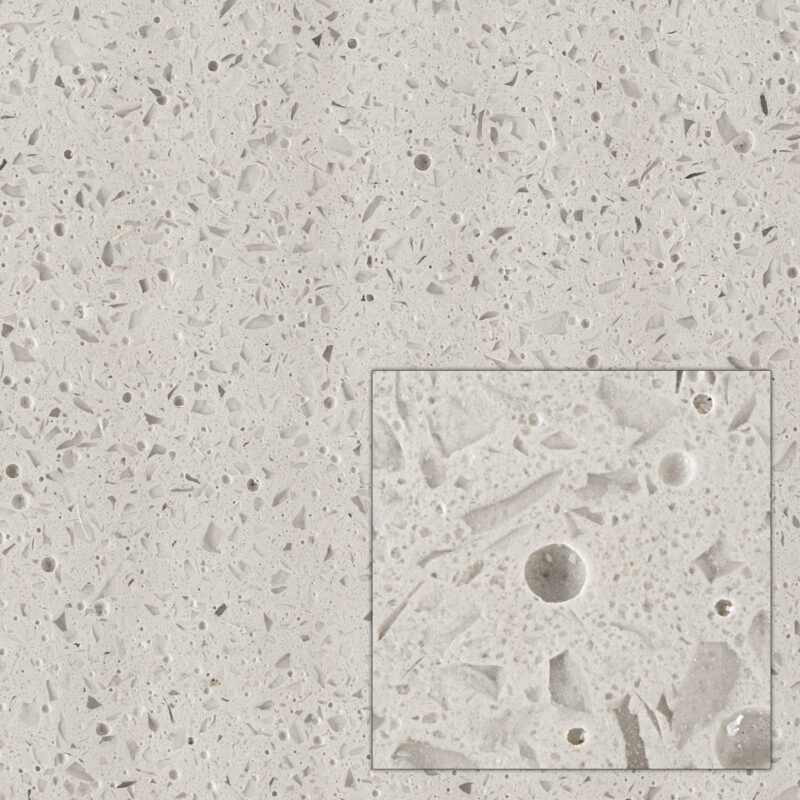
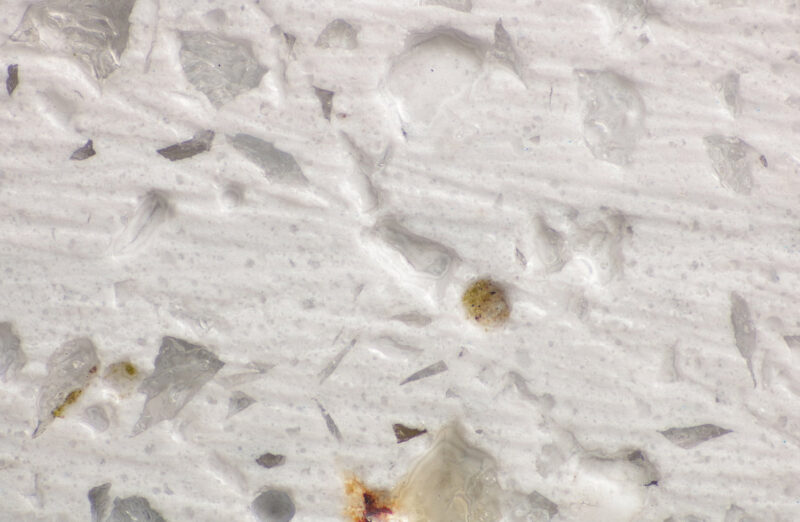
The imaging provided deep context into why surface roughness would have such a high impact on the L value, as witnessed by the profilometer and spectrophotometer data. After comparing various stages of surface honing methods several critical discoveries emerged—significantly altering both production and long-term maintenance strategies.
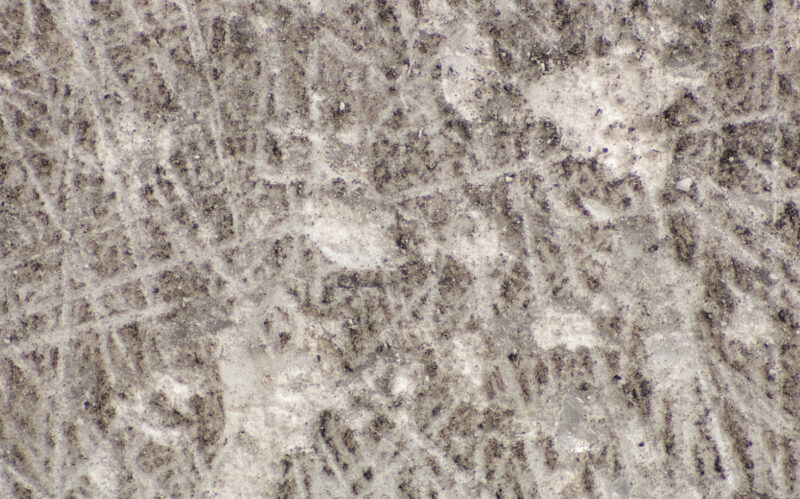
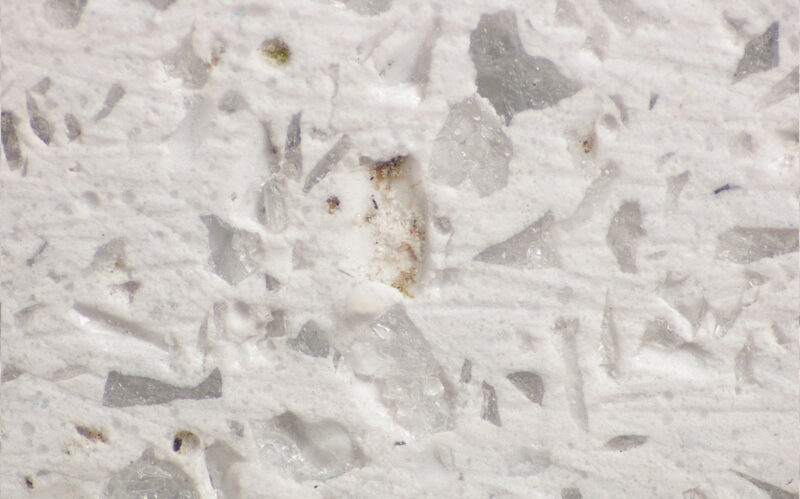
Surface Roughness Comparison (Honing Level 1 / Honing Level 4)
Key Discoveries
-
Surface Roughness Affects Light Absorption
As the panels were honed smoother, the surface absorbed more light, leading to darker visual appearance.
-
Aggregate Exposure Shifts L-Value
Increased exposure of glass aggregate altered the light–dark balance (L value), creating visible color shifts.
-
Highly Polished Aggregate “Traps” Light
When the glass particles were honed smooth, they reflected less light and created the appearance of tiny dark points, contributing to overall darkening.
-
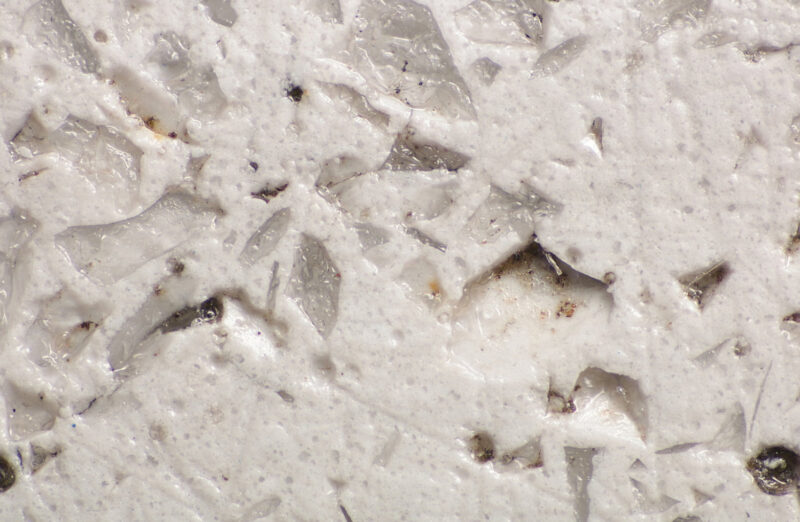
Porosity is Contributor
Tiny porosity cavities also contribute to the shift in L-Value
-
Debris Accumulation Shifts L-Value
Debris accumulated in microscopic pores and pockets in the gelcoat, and common cleaning methods failed to remove it—significantly affecting color consistency post-installation.
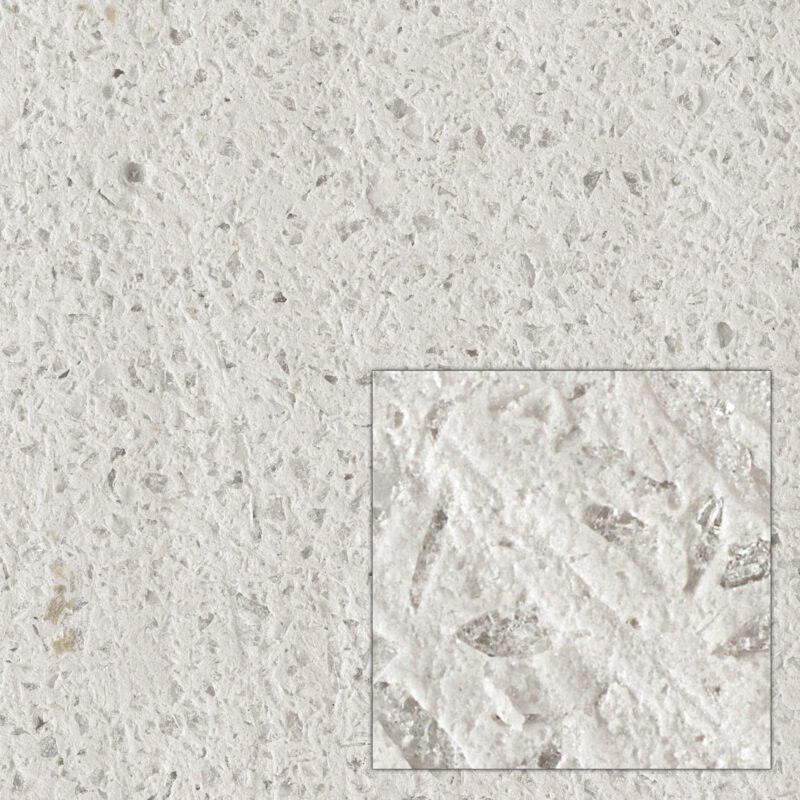
Surface Roughness Levels
Honing Level 1
Honing Level 2
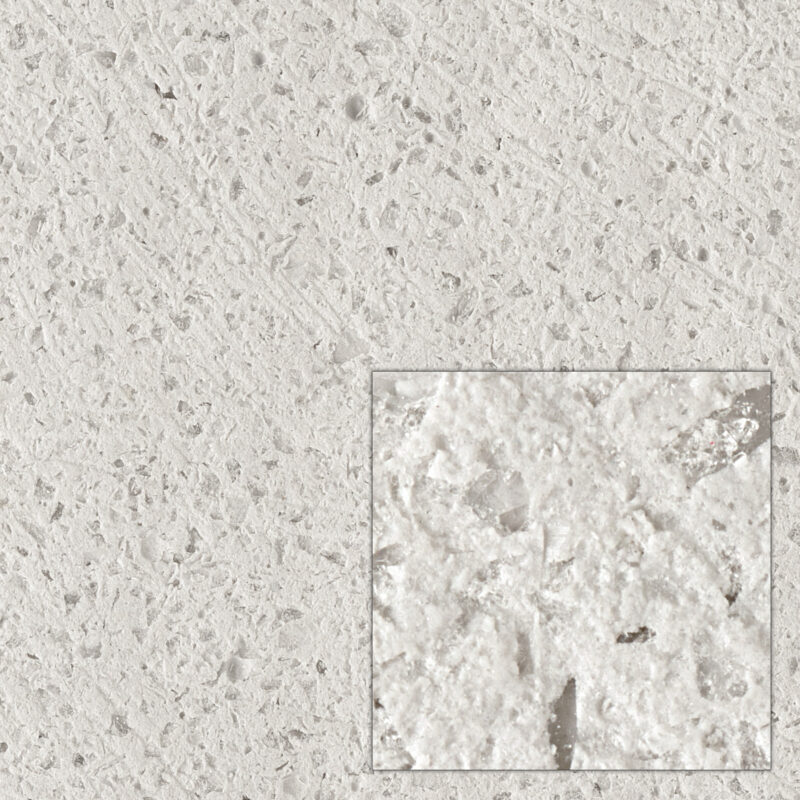
Honing Level 3
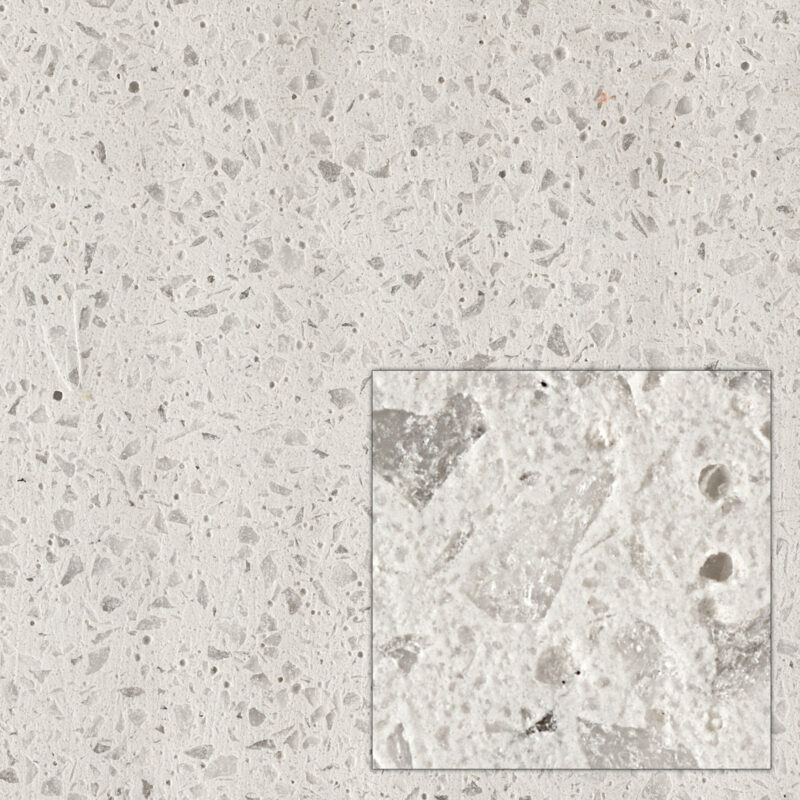
Honing Level 4
Rehoning Example
Before and After Examples of heavy debris / suit before and after re-honing.
Rehoning Example
Before and After Examples of standard hand cleaning vs re-honing
The Team at GIGAmacro
At GIGAmacro, we are proud to support Kreysler & Associates in solving high-stakes surface-finish challenges at architectural scale. Magnify2 provided the rapid, detailed insights needed to diagnose the root causes of variation and to refine both production and maintenance processes.
We look forward to supporting future projects where surface quality, precision, and consistency are mission-critical.